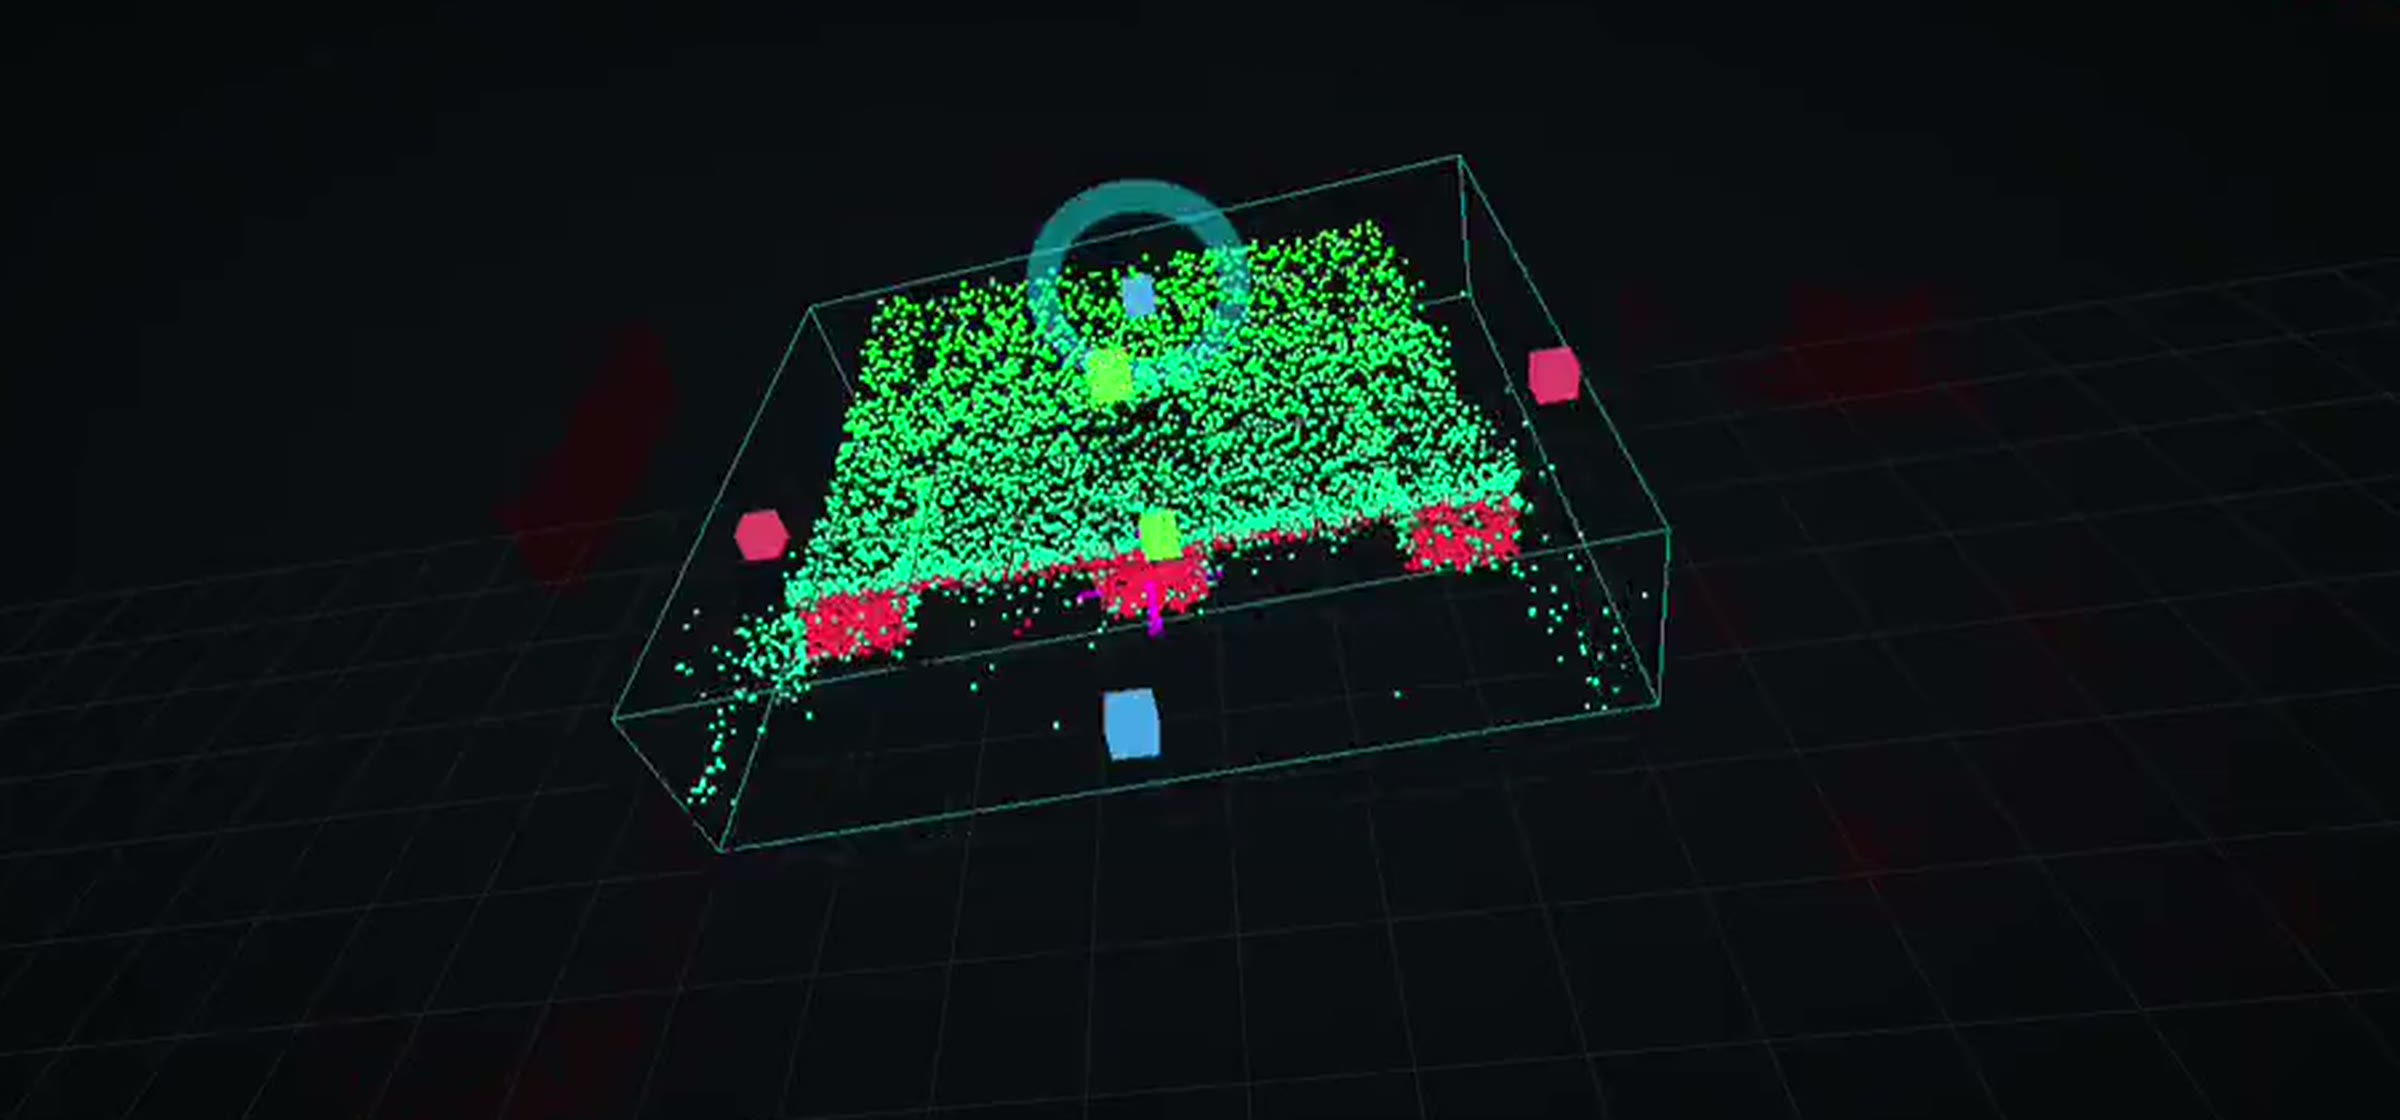
01 · Vision
What the robot sees
SLAM maps, ToF point clouds and LiDAR safety zones — the raw perception layer, recorded from the robot. Including where it stops working.
Every application here is shown the same way: what the robot sees, how it gets installed, and the proposal that scoped it. Filmed on real floors, not rendered.
A performance claim is worth what you can verify about it. So each application on this site carries the same three pieces of evidence — and each one can be inspected without a sales call.
SLAM maps, ToF point clouds and LiDAR safety zones — the raw perception layer, recorded from the robot. Including where it stops working.
Survey, mapping, mission build, safety test. The same five steps on every deployment, with the time each one actually takes.
A deployment simulator you can run yourself: demand in, fleet size, cycle time and install window out — with every assumption printed.
These are the four workflows that pay for themselves first — chosen because the loop is measurable, not because the robot looks good doing it.
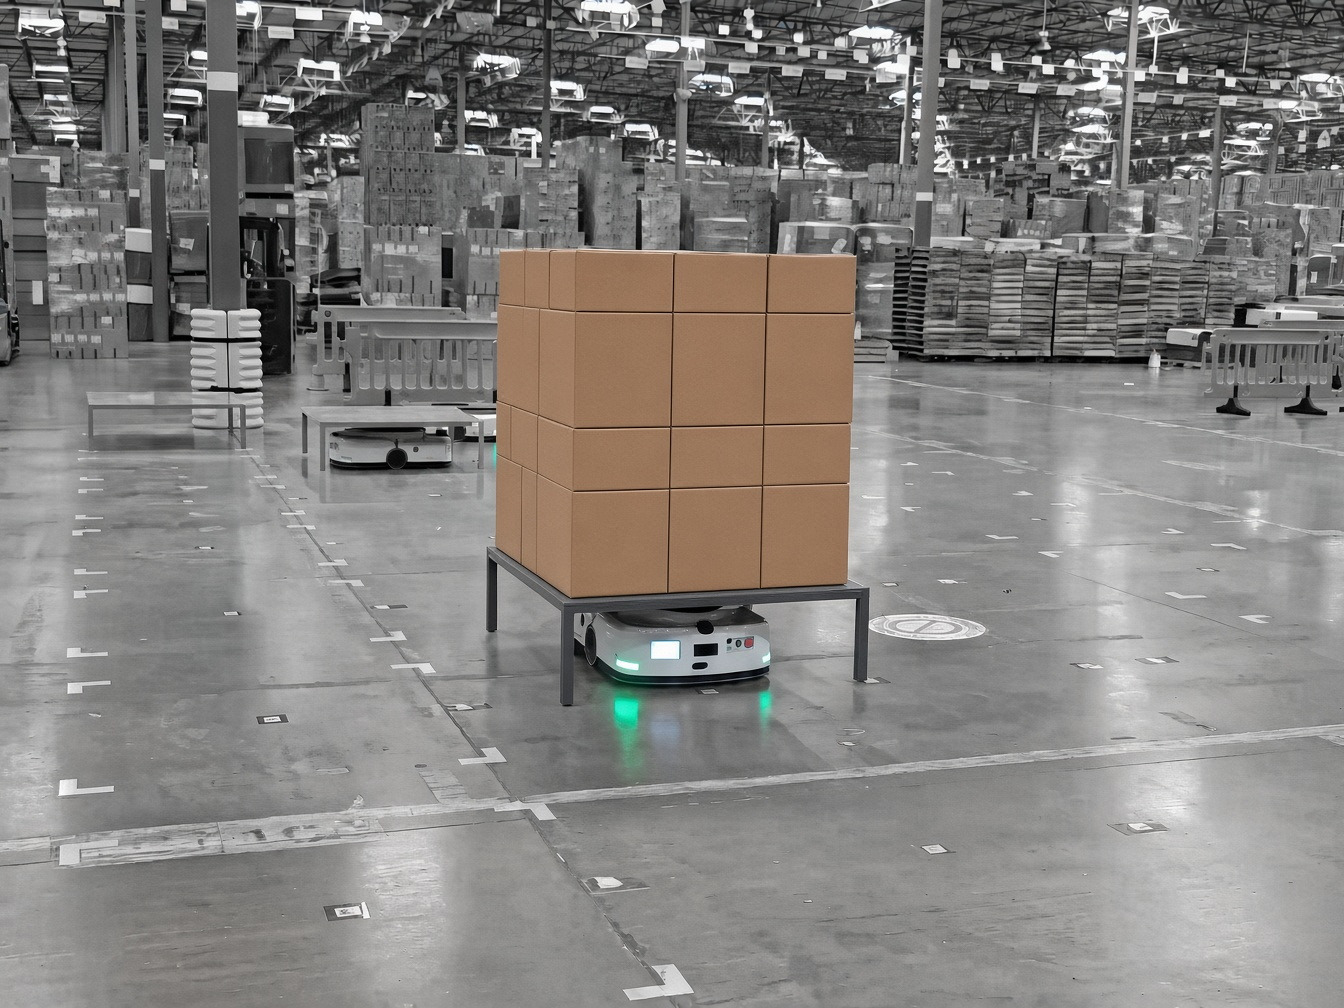 Application 01
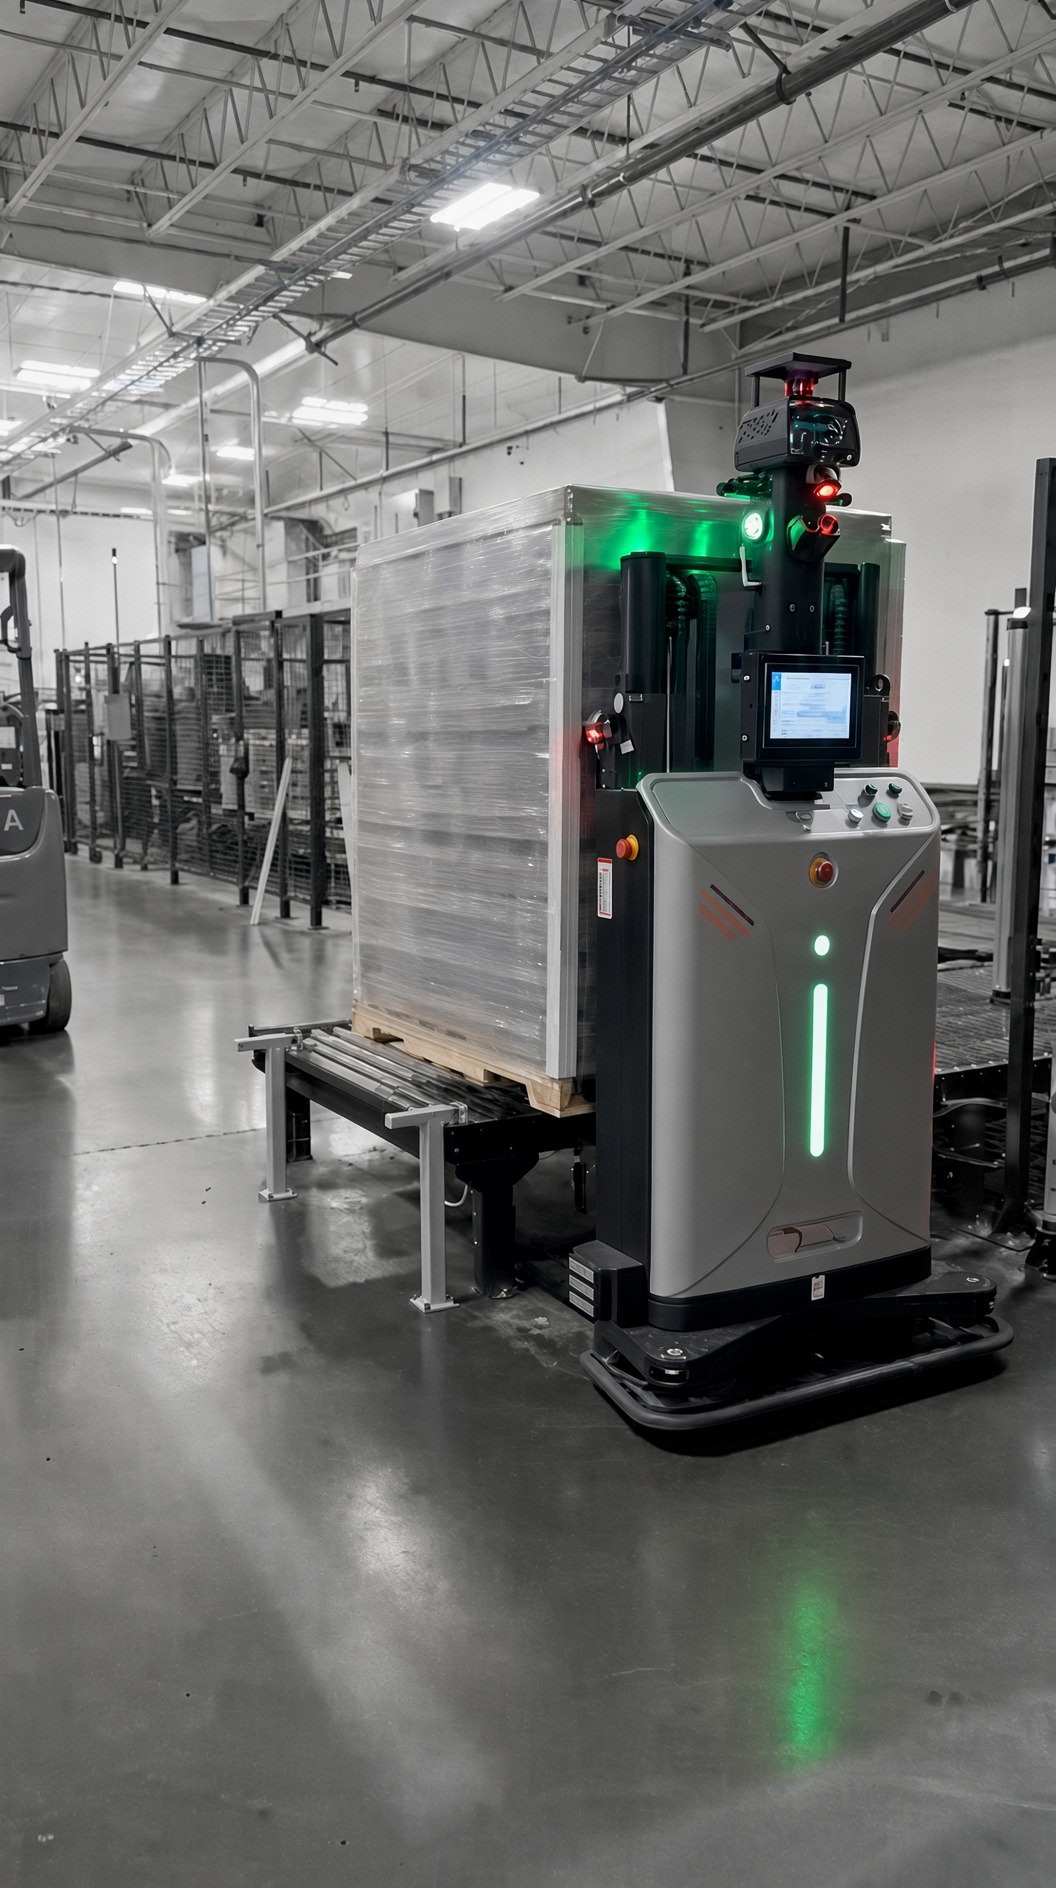 Application 02
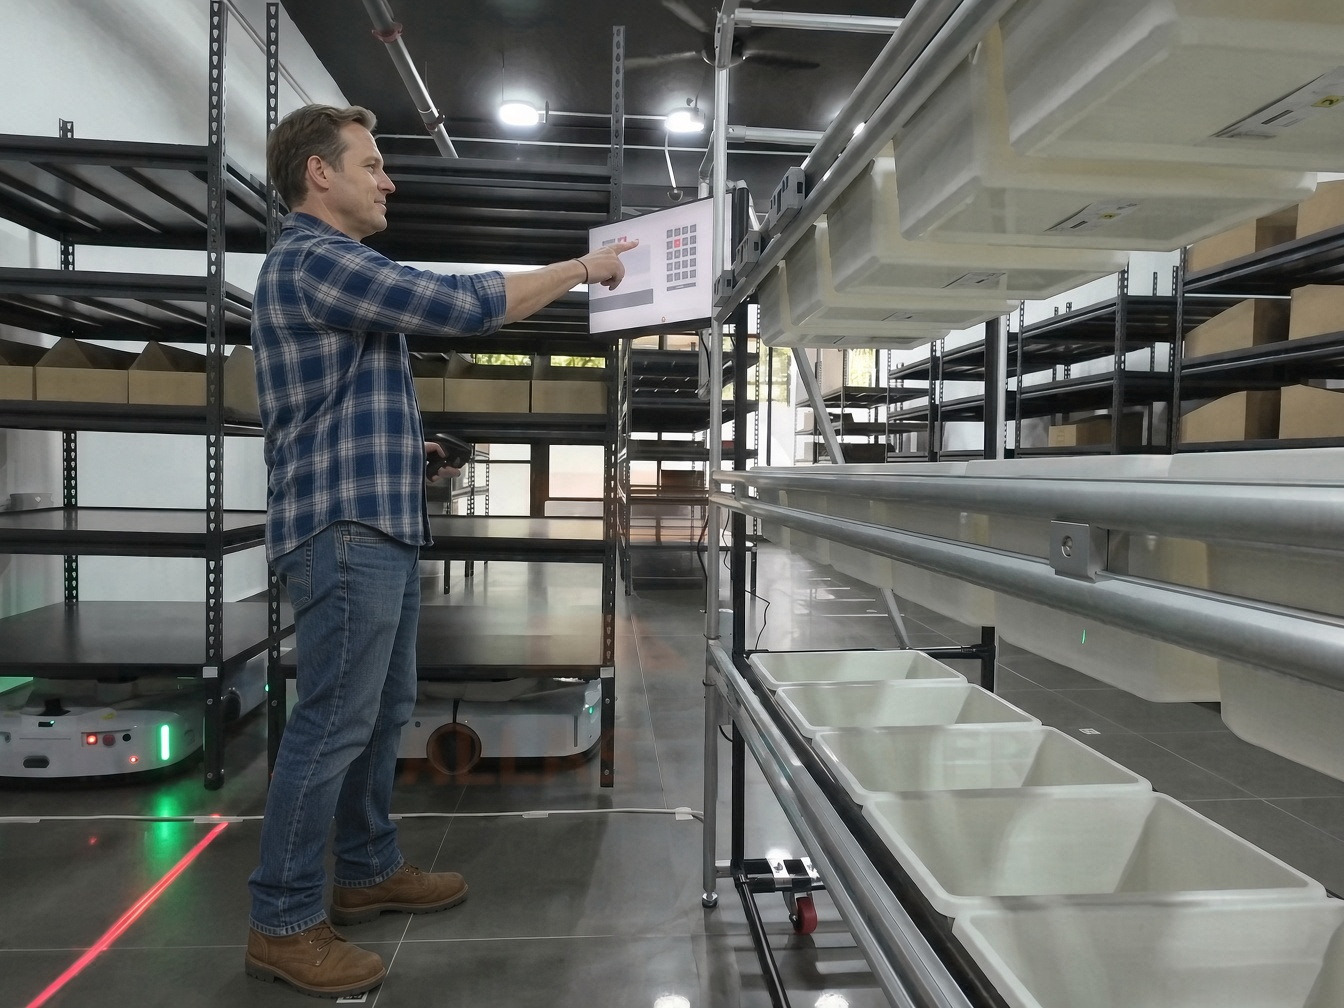 Application 03
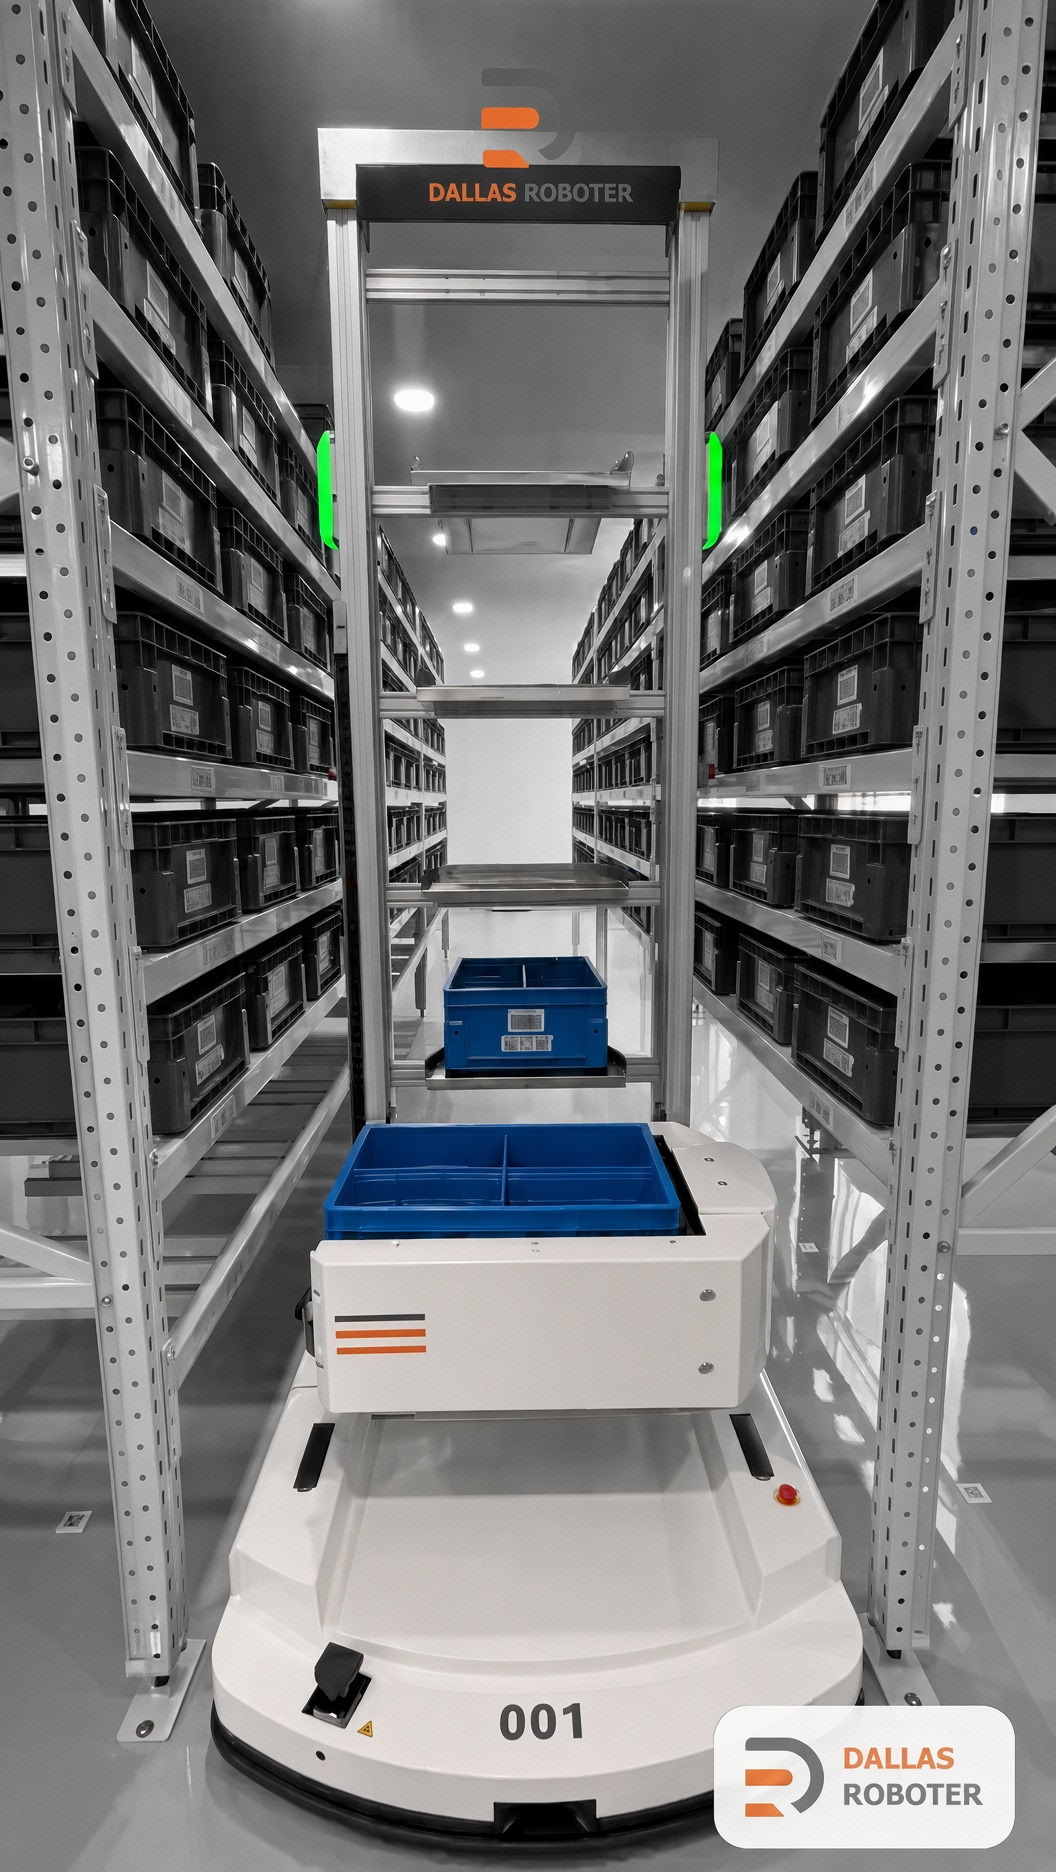 Application 04
The robotics industry runs on renders and adjectives. This site is built on the opposite rule, so it is worth stating the rule plainly.
Pick one workflow. We will map it, show you what the robot sees, and put a number on the fleet before anyone signs anything.